Credit-risk monitoring and treasury analytics for Investcorp
An ESG materiality classifier sorts portfolio news by credit impact. A treasury agent extracts rate quotes and response times from bank emails for natural-language queries.
- Partner
- Investcorp
- Timeline
- Spring 2026
- Status
- In use at Investcorp

Investcorp is a global alternative investment firm. In February, their technical lead walked us through possible uses for AI across the firm. We chose two self-contained pilots that could be built without weeks of security reviews, and twelve of us split into two teams to work on them. Both had to use Python, run on Investcorp's Azure infrastructure, and work from the command line before we built dashboards.
Pilot one: ESG materiality classification
One of Investcorp's businesses manages collateralized loan obligations (CLOs), funds made up of loans to multiple companies, usually 75 to 100 of them. If one of those companies gets sued, loses a factory to a flood or loses its CEO, the credit team wants to know before the news shows up in the price of the loan. Before this project, the credit team kept up with this news mostly by hand.
We needed a definition of materiality before we could build a useful classifier. For the credit team, an environmental, social or governance (ESG) event mattered if it could affect a company's ability to repay its debt. A controversy that briefly moved the share price did not carry the same weight as a lawsuit that could bankrupt the company. We used that distinction to define three credit-risk tiers.
- High
- A real chance of hurting the company's ability to pay its debt soon, such as bankruptcy filings, major lawsuits, enforcement actions or supply chain breaks. These come with a short analysis and a suggested next step.
- Medium
- Worth watching but not yet worth acting on, such as early litigation, governance concerns or sector headwinds. These get a short summary and are tracked in case they grow.
- Low
- Logged for the record, without inbox notifications.
The system runs weekly rather than in real time because credit events tend to build over days and weeks. A weekly report is easier to read carefully than a stream of alerts.
- 01
News feeds
the sources the credit team already reads
- 02
Classifier
High, Medium or Low by effect on credit
- 03
Weekly report
analysis for High, summaries for Medium
- 04
Memory
every event logged by company and industry
A weekly report also needed context from earlier weeks. Three medium-tier events for the same company in a month could justify a higher tier even if no single event would. We logged events by company and industry so the classifier could use that history on the next run. We also designed a feedback path for the credit team to correct classifications, rather than rely on our judgement of what mattered.
Analyst workspace and portfolio views
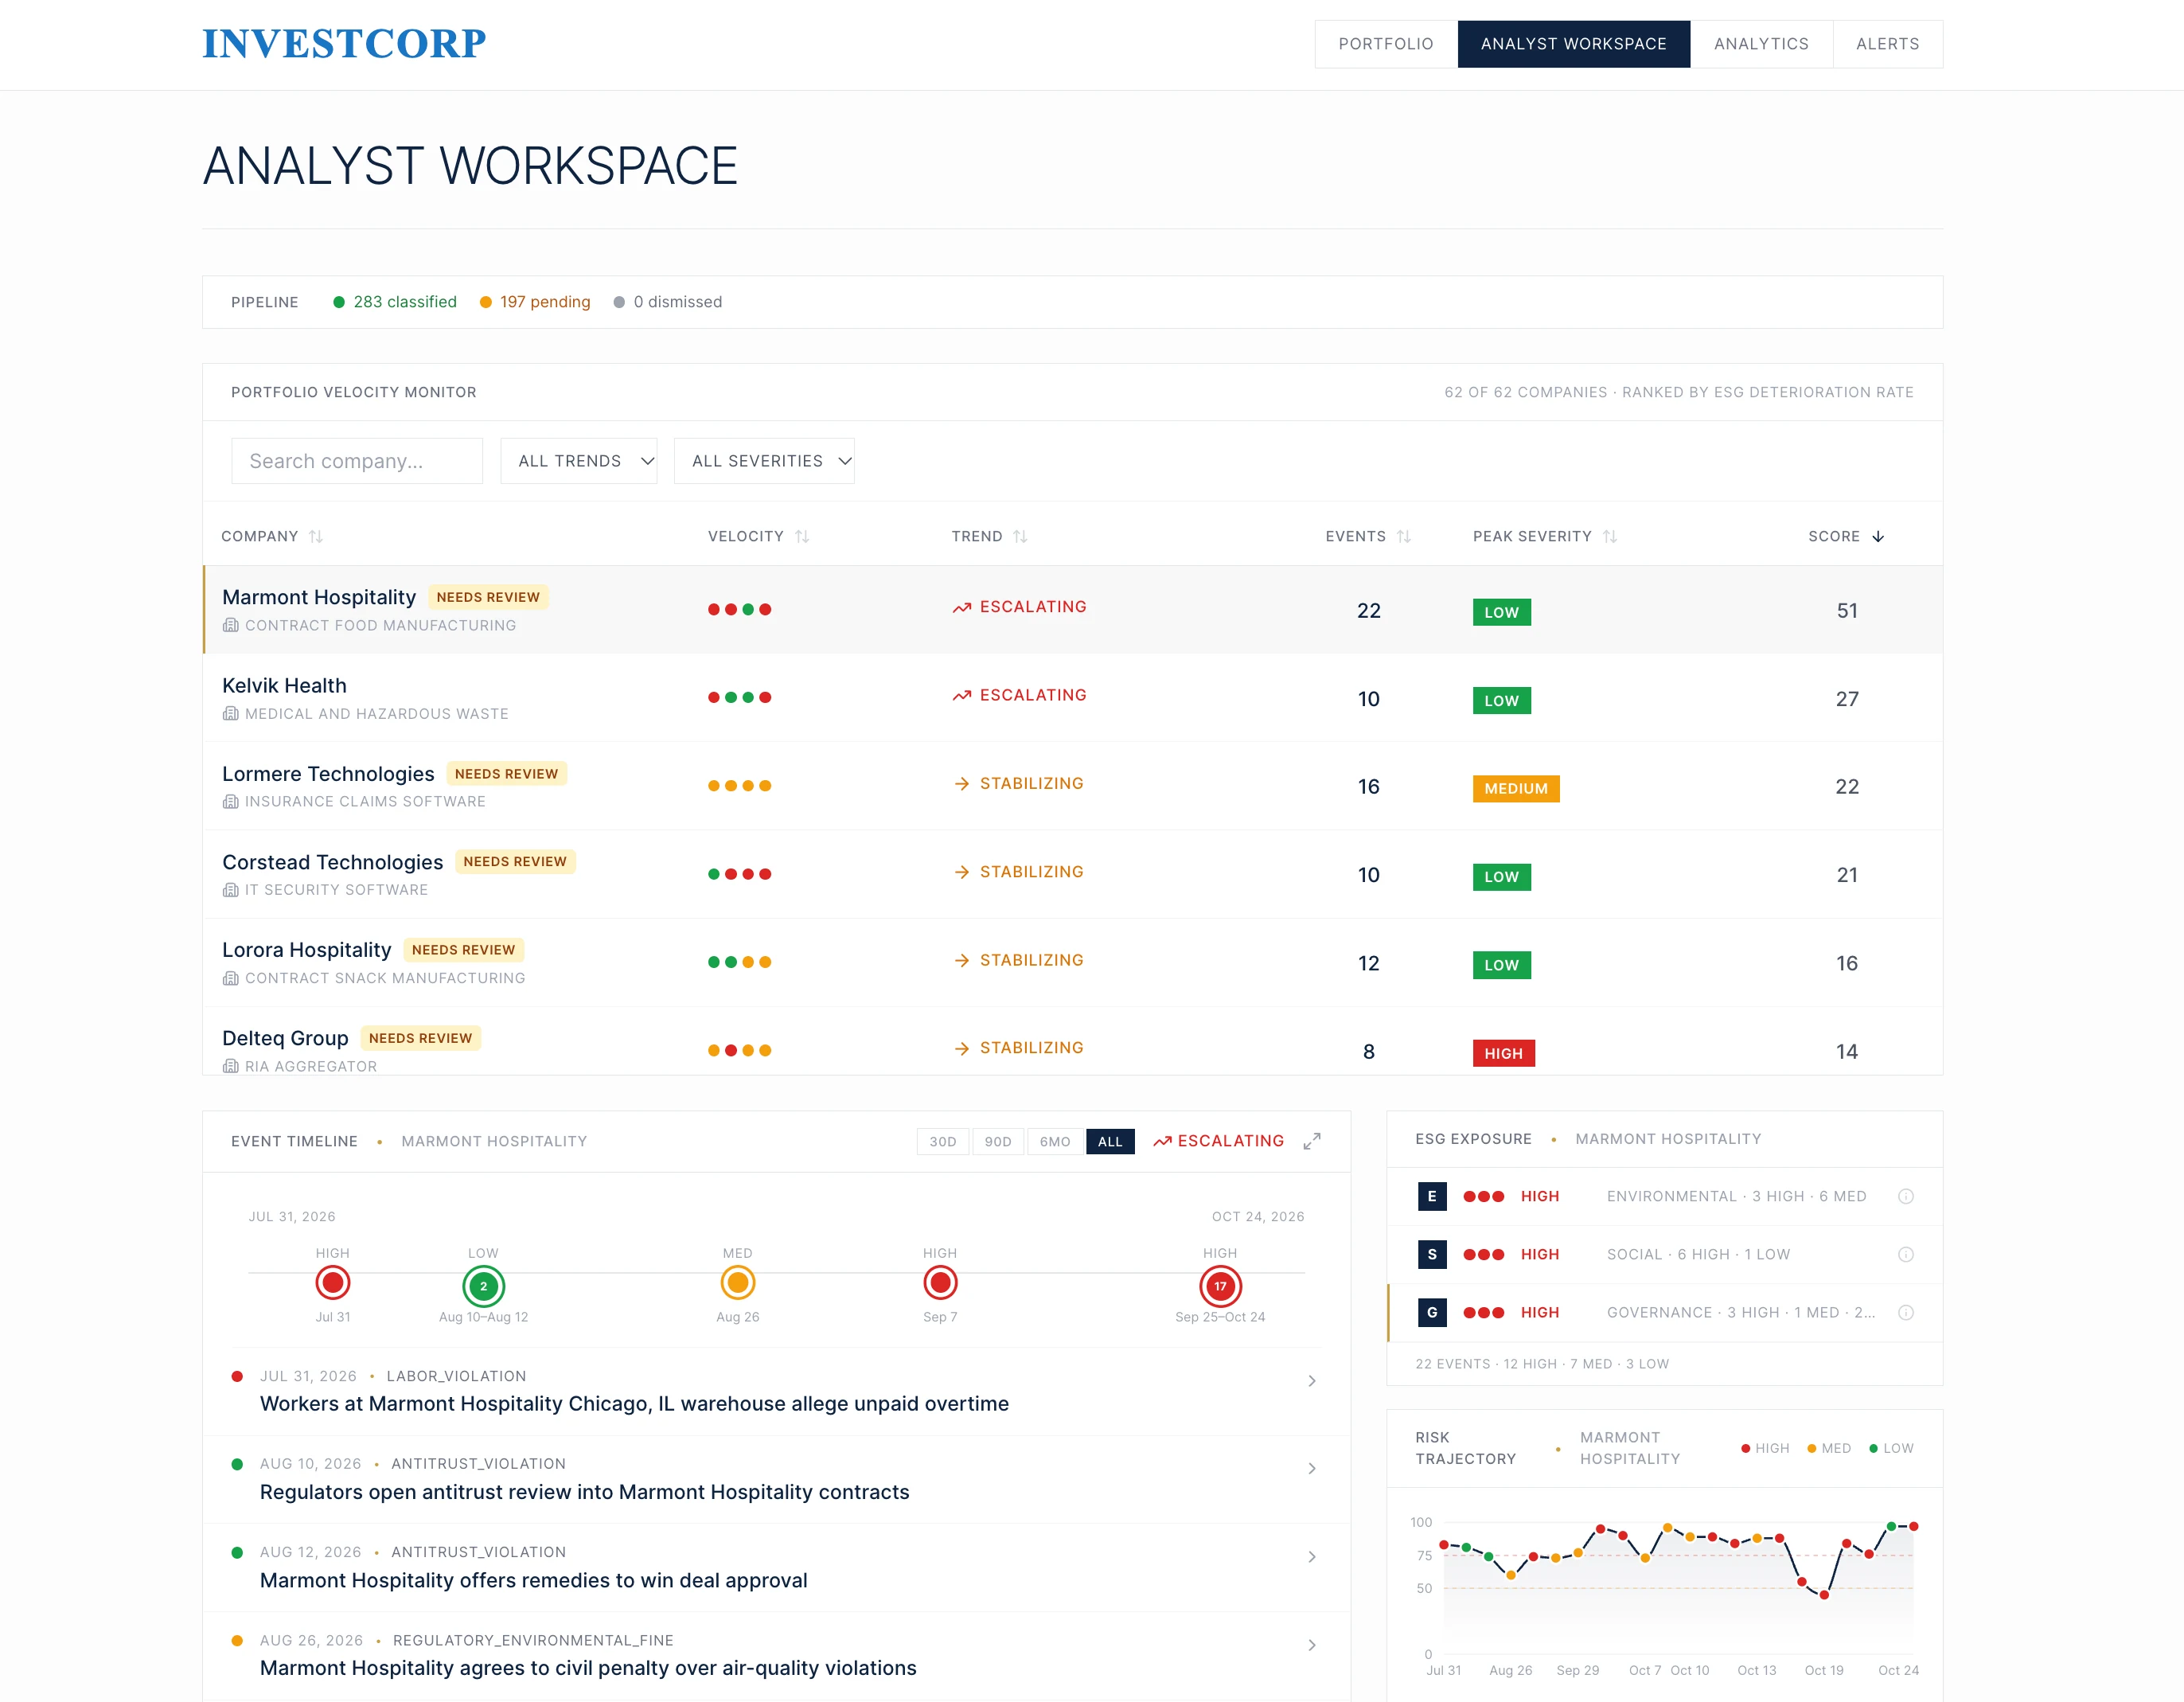
The pilot grew into a product the credit team uses. The analyst workspace ranks every company in the portfolio by how quickly its ESG risk is getting worse. Each row shows how fast events are arriving, whether things are escalating or settling down, the worst severity so far and an overall score. Selecting a company shows its timeline of events, its exposure across environmental, social and governance issues, and how its risk has moved over the last few months.
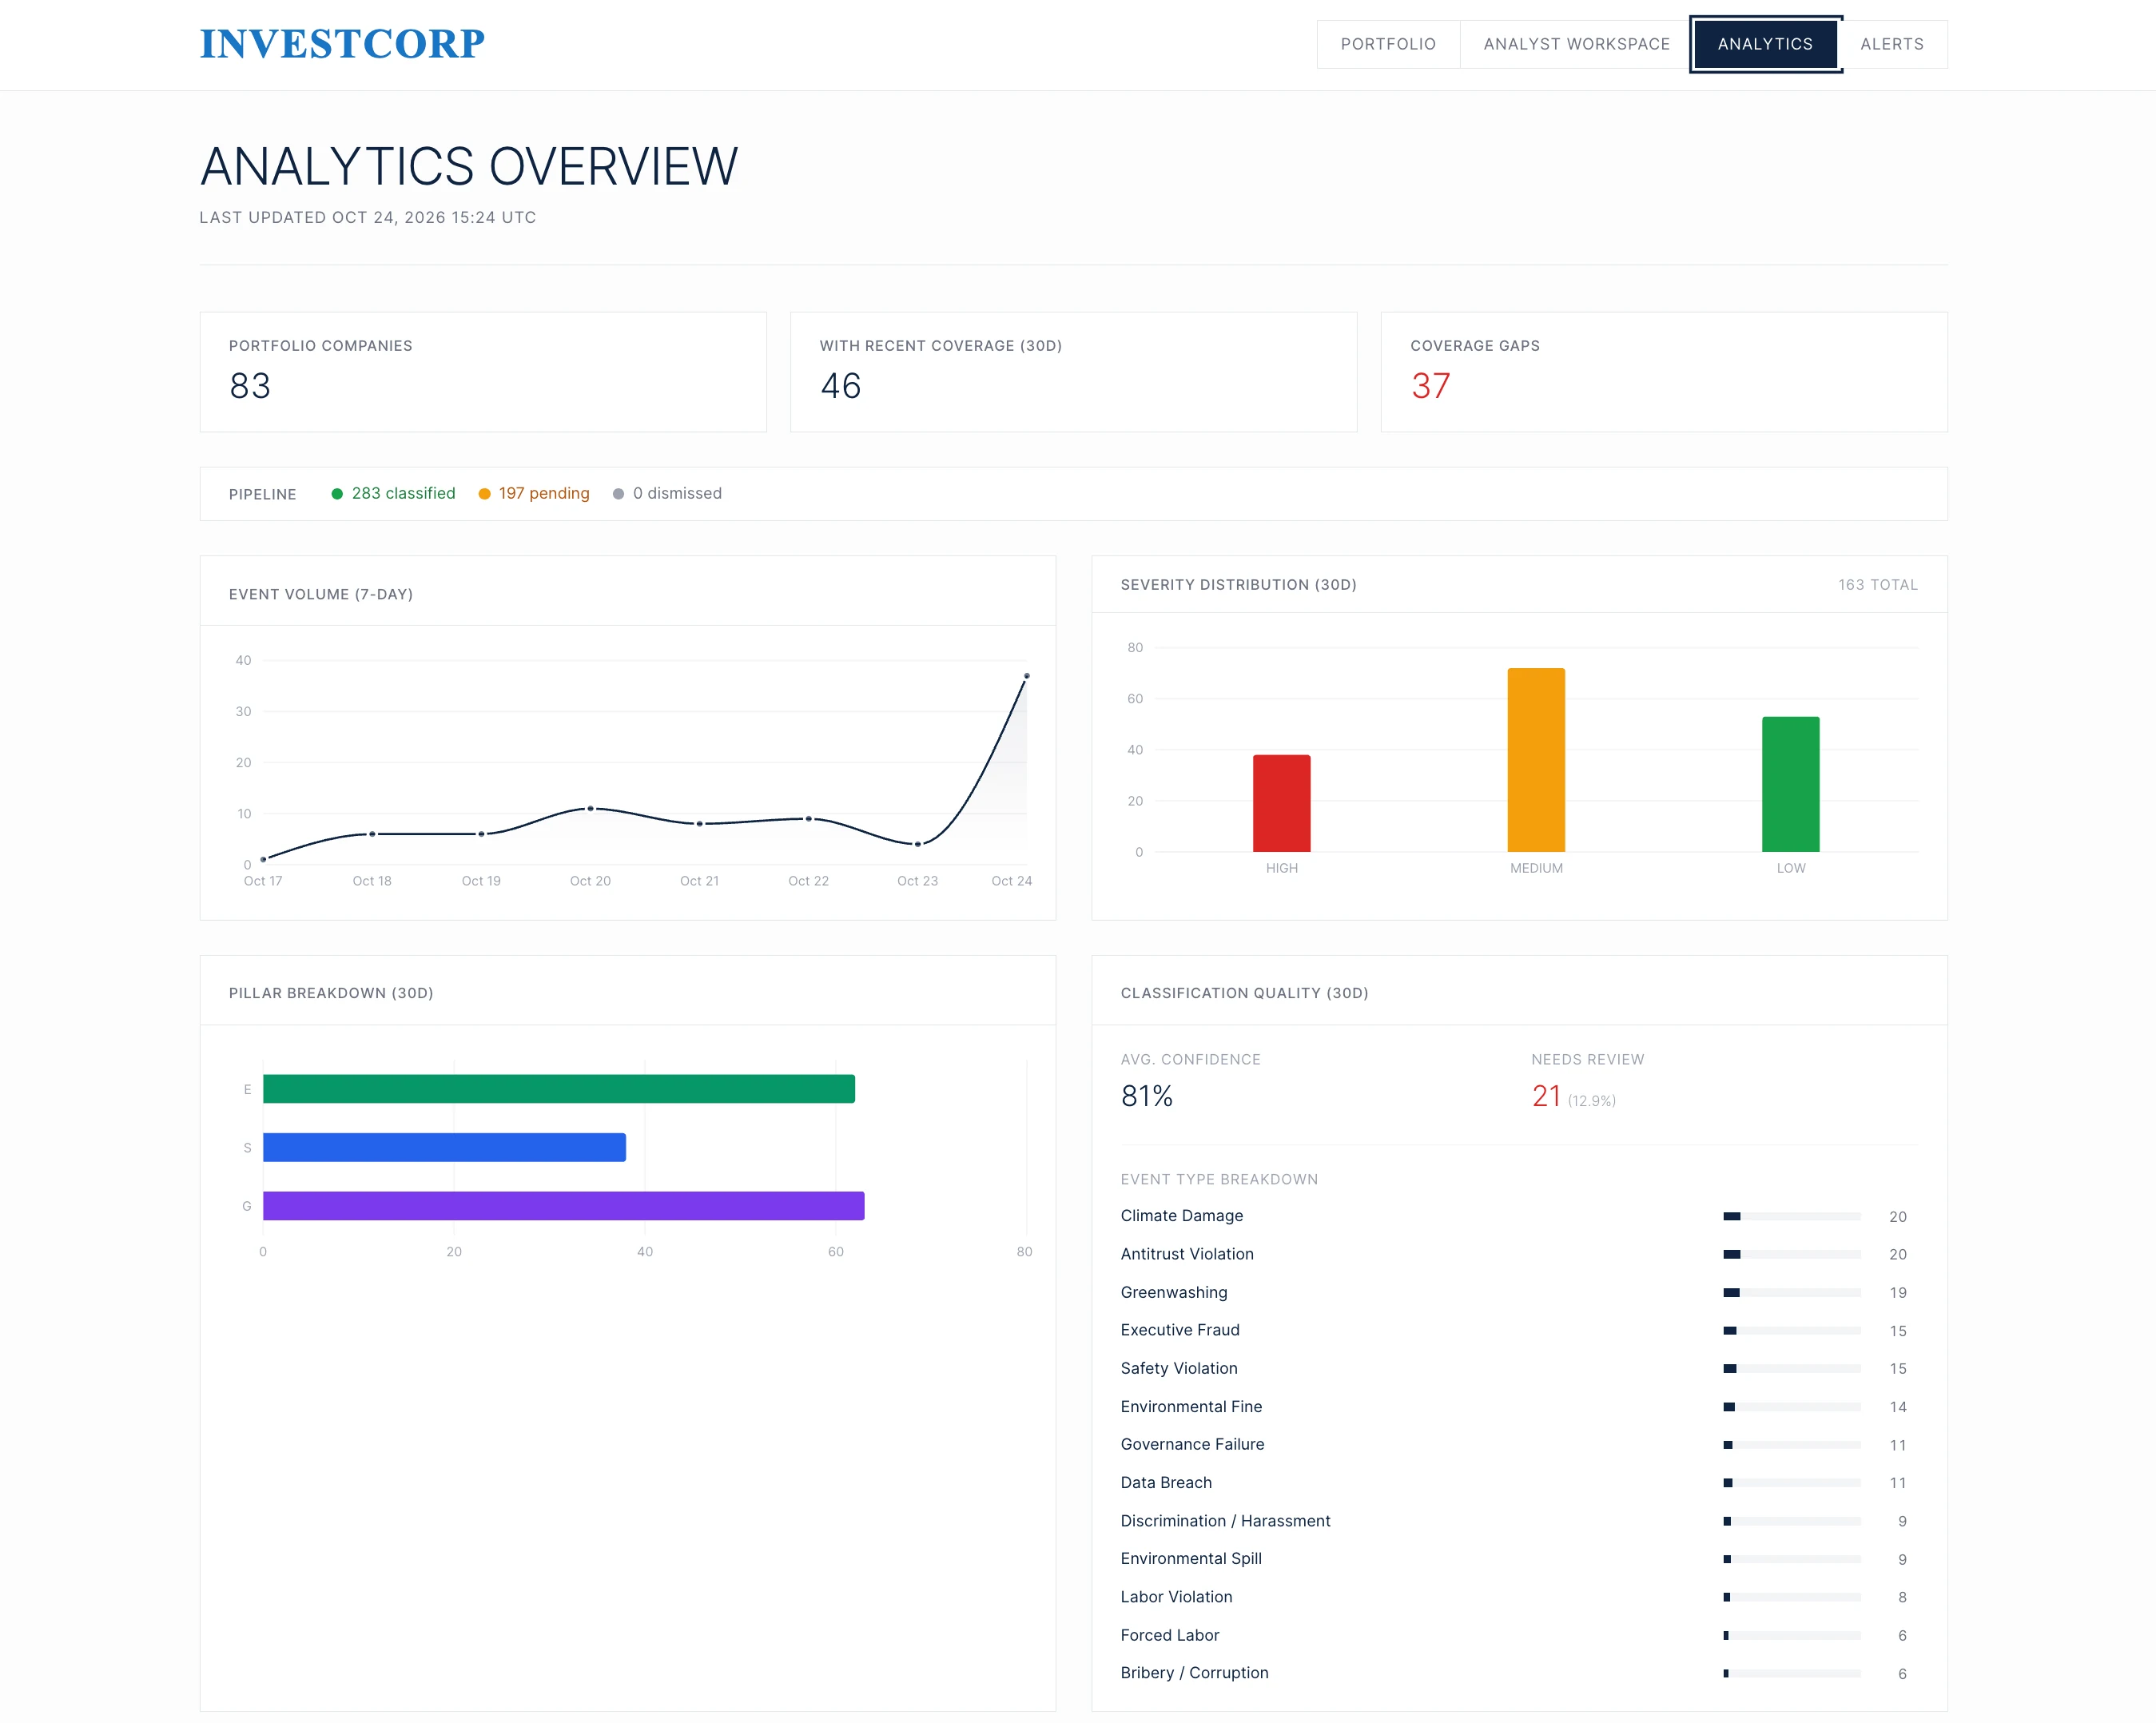
A second page tracks the system itself. It shows how many events have been classified and how many are waiting, and which companies have had no news coverage lately. Private companies can go weeks without coverage, and a company with no news may still be in trouble. The page also shows how events split across severity and pillar, and how confident the classifier is. Events the classifier is unsure about go to a review queue for a person to check.
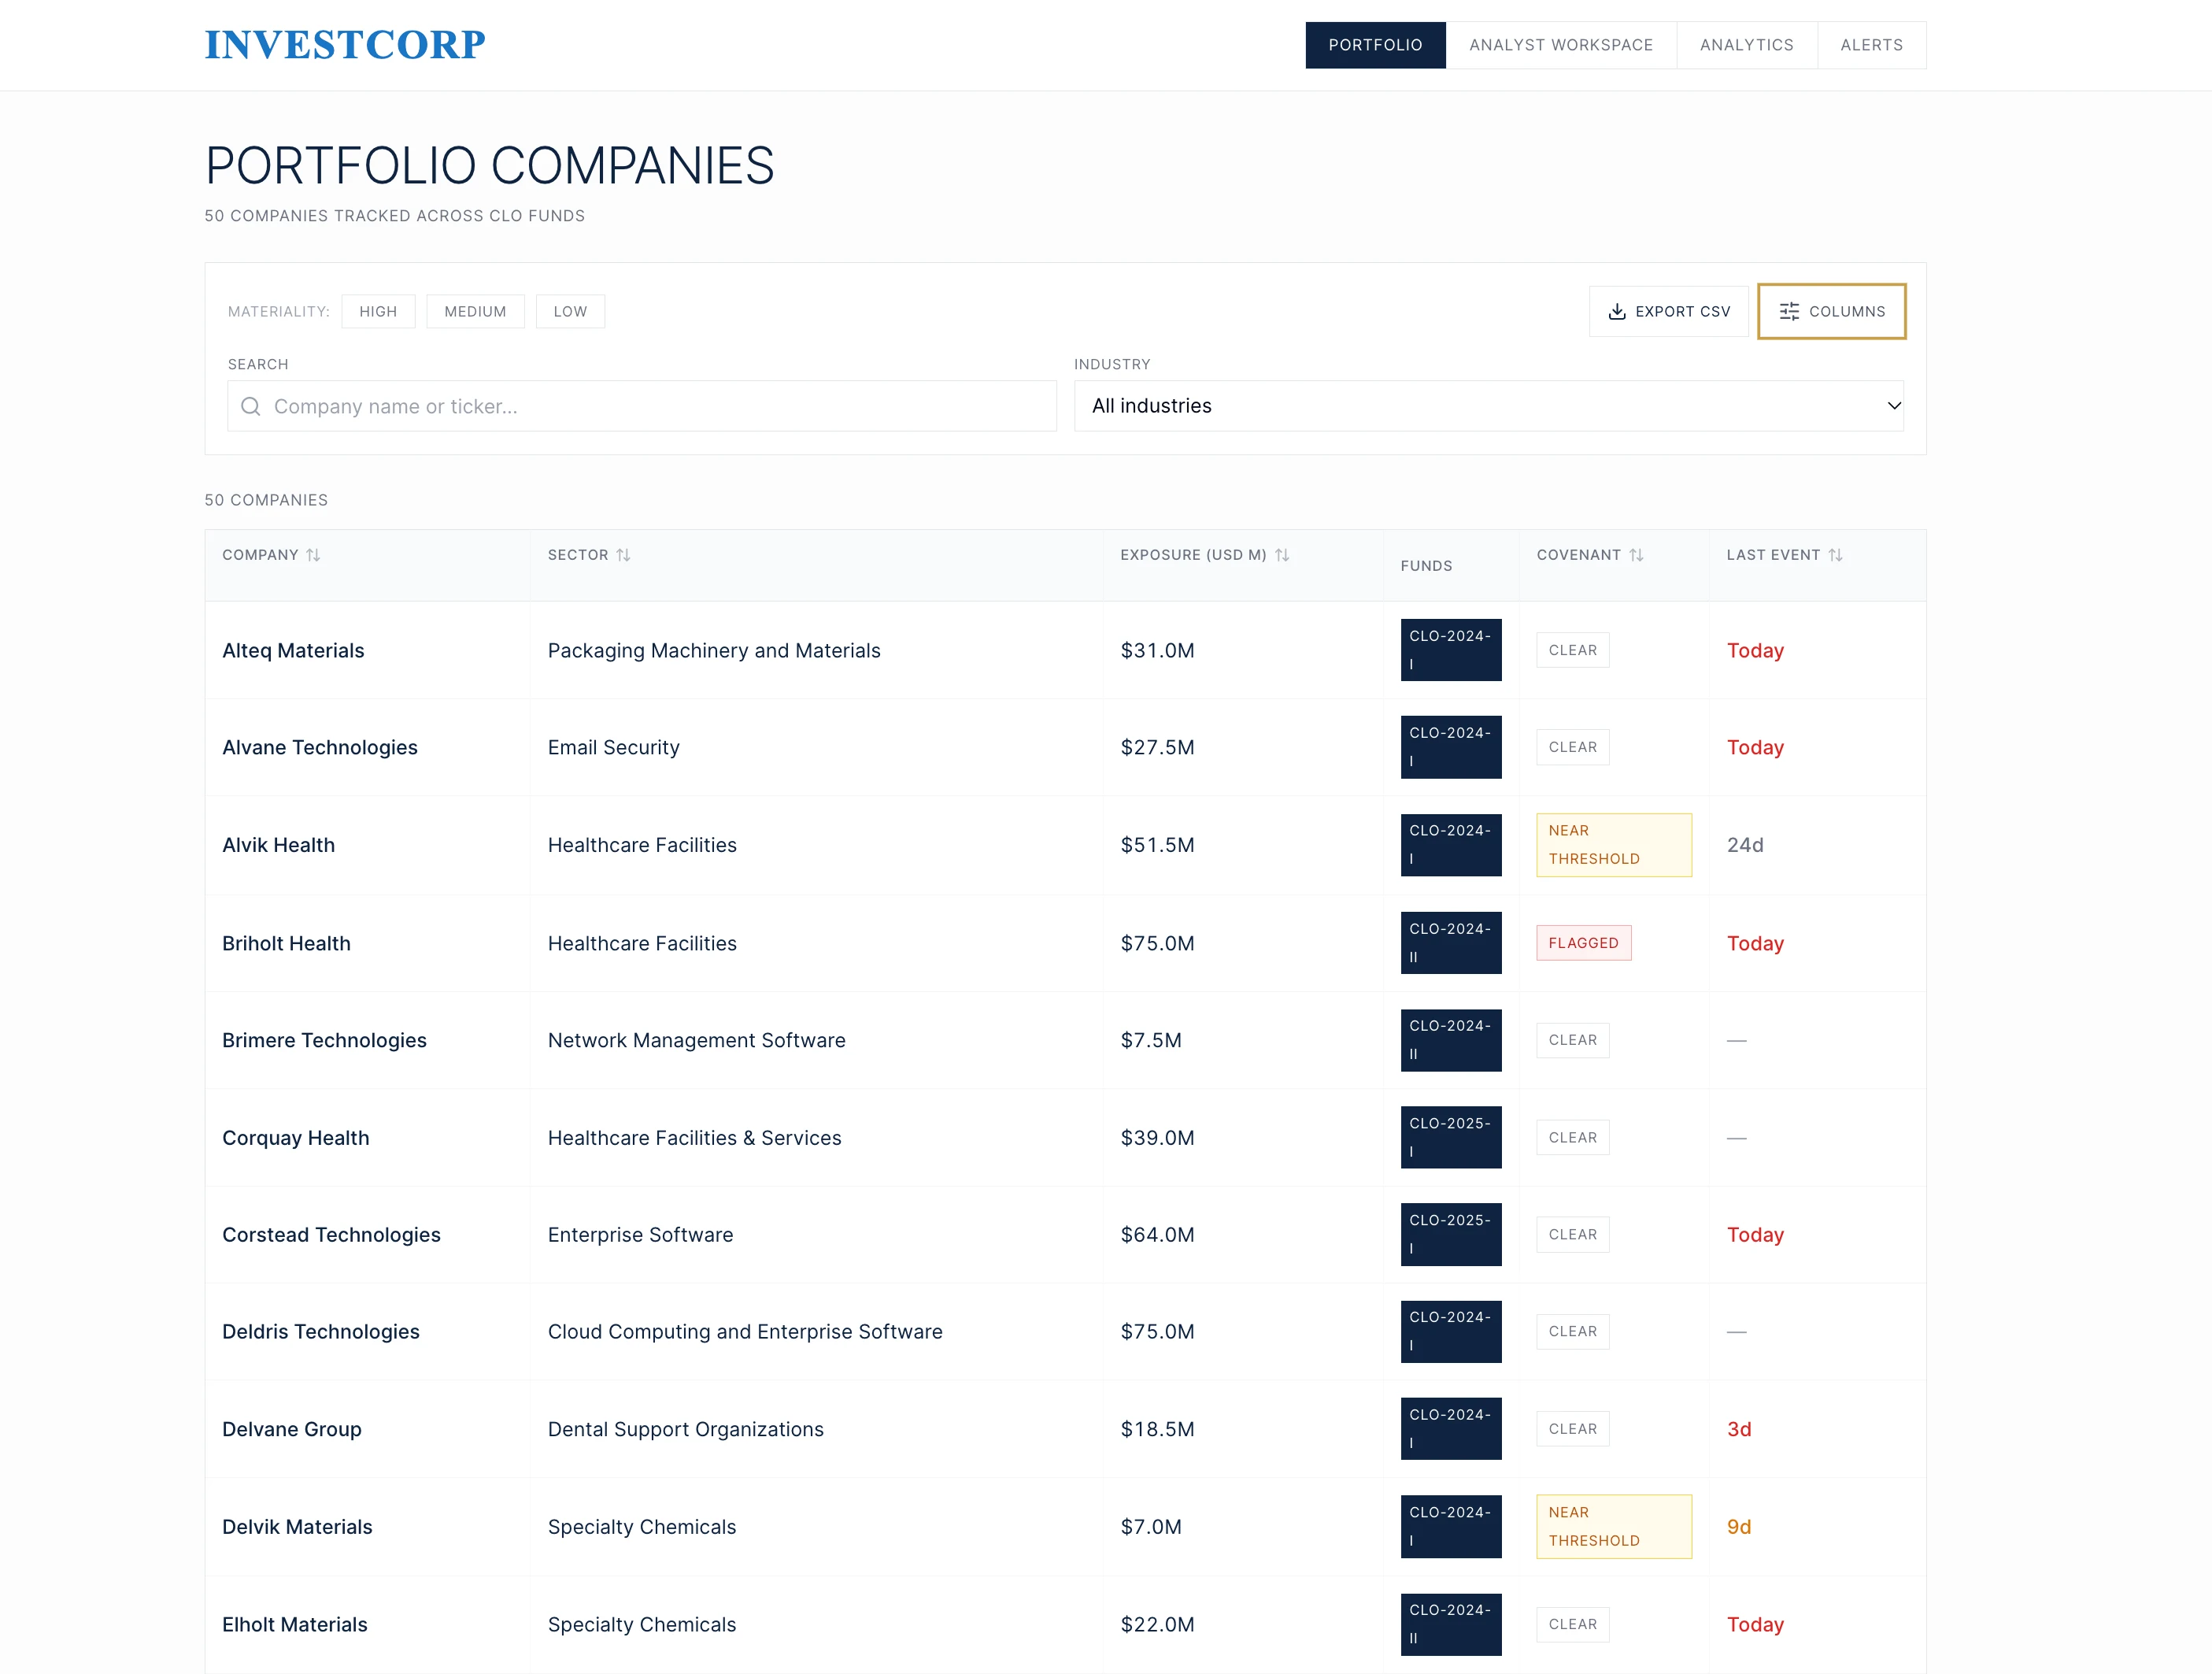
The portfolio view lists every company tracked across the CLO funds. For each one it shows the sector, how much Investcorp has lent, which funds hold the loan, whether the company is close to breaching a covenant, and when it last appeared in the news. An analyst can start here when a company's name comes up in a meeting.
Scoping and deployment
Over spring break, we scoped the first version across six workstreams: requirements, architecture, the materiality framework, news sources, prior art, and the feedback loop. Everything runs through Investcorp's own Azure OpenAI deployment. Their portfolio data never leaves their cloud.
Pilot two: treasury email extraction
Investcorp's treasury team requests indicative rates from banks each week. Replies arrive in a shared inbox as body text or attachments, sometimes late or not at all. The team previously read and consolidated these replies manually.
Our agent monitors the inbox, extracts each bank's quoted rate and response time, and writes them to a database. Those were the two metrics treasury prioritized. A natural-language query interface answers questions such as which banks responded slowest this quarter. It can also chart the results.
- 01
Weekly outreach
same subject line every time
- 02
Replies land
in the email body or in attachments
- 03
Agent reads
rate quoted, time to reply
- 04
Database
one row per bank per week
- 05
Ask in English
answers and charts
Bank 4 took 31 hours on average and missed two of twelve weeks. Bank 2 was next at 22 hours.
What we took away
The hardest design work was deciding what counted as material credit risk. A classifier that found every ESG headline would still leave the credit team to decide which events could affect repayment. Defining the tiers gave us a target for the classifier and a reason to leave low-impact events out of the inbox.
Keeping the first version small let us exercise the complete workflow, from collecting news to producing a weekly report, rather than partially cover every market and signal. We also built on Investcorp's Azure infrastructure and model deployment from the start, so there was no deployment migration to do at the end.