Evidence weighting in model probabilities
Models can identify individual reports correctly yet give their combined evidence probabilities that fall on the wrong side of a decision threshold. Synthetic reports make the mismatch measurable against an exact Bayesian reference.
- Type
- Research
- Timeline
- Fall 2026
- Status
- Exploratory research

A model's reported probability may determine whether a case receives further review. A system using a 0.95 cutoff needs the probability to reflect the strength of the evidence, even when the likely YES/NO answer is already clear. This project tests that relationship using fictional reports with known reliability and an exact Bayesian reference.
Two ways to cross the wrong threshold
Consider a fictional food inspection. Each inspector reports whether a batch is contaminated (YES) or clean (NO). The prompts specify equally likely outcomes and reports that are independent given the batch's true state. Each inspector has the same known chance of being correct in either direction.
The experiments contain examples where mean reported probabilities and the specified probabilities fall on opposite sides of a 0.95 cutoff, in both directions.
- Too little confidence
- 48 of 64 reports favor YES at 55% reliability. The specified probability is 0.998, but Jev's Noul readout gives a mean of 0.762. The reference clears the cutoff while the mean reported score does not.
- Too much confidence
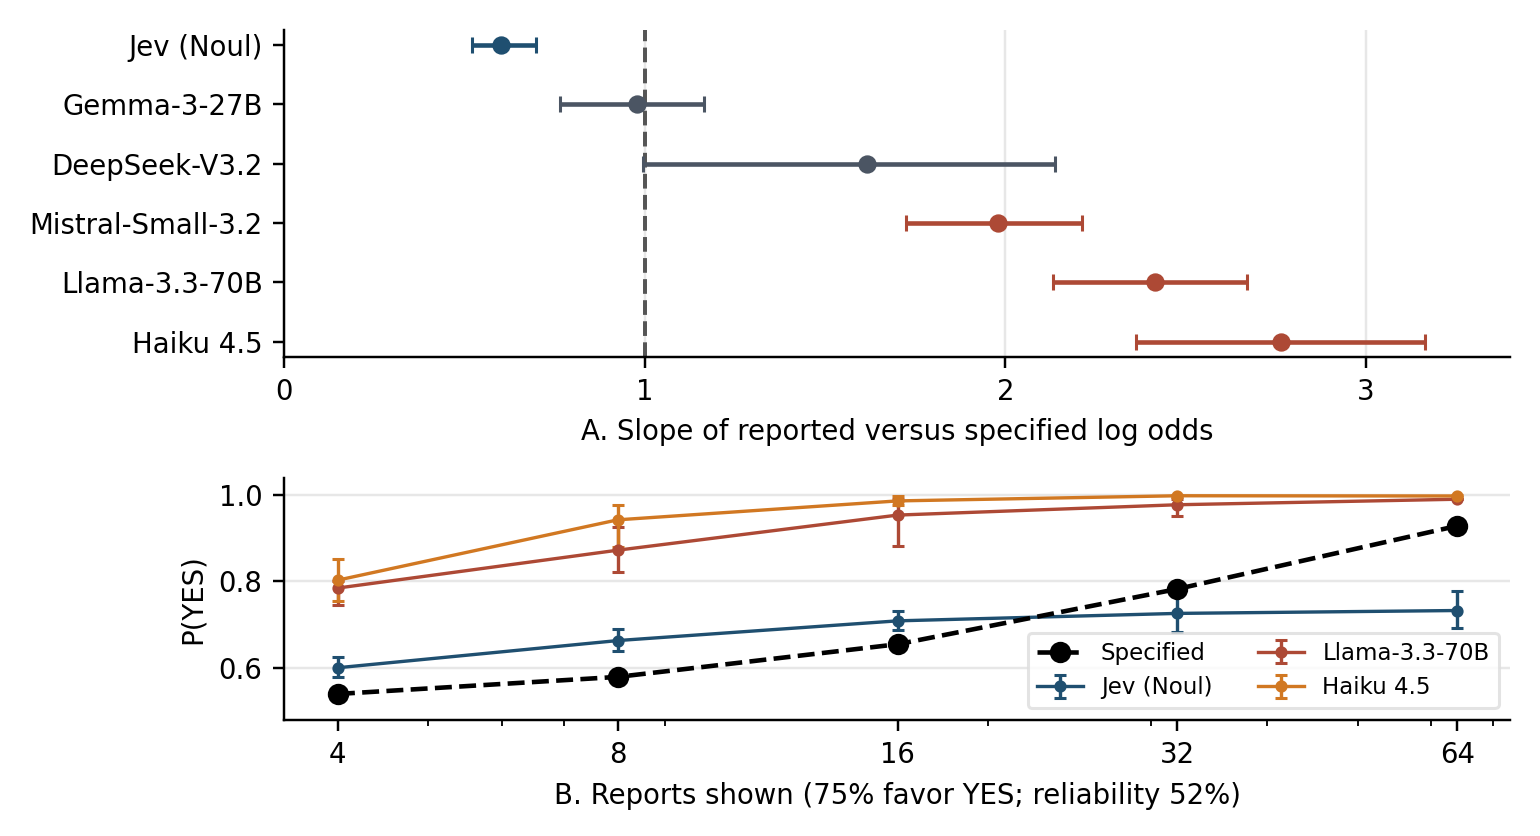
- 12 of 16 reports favor YES at 52% reliability. The specified probability is 0.655, while Llama-3.3-70B and Haiku 4.5 report means of 0.953 and 0.986. Both mean scores clear the cutoff while the reference does not.
Why the amount of evidence matters
Three YES reports out of four and 48 out of 64 both give a positive share of 75%. At 55% reliability, the smaller set implies a probability of 0.599 and the larger set implies 0.998. A score that mainly tracks the positive share misses the difference between a few weak observations and many independent ones.
For n reports, of which k favor YES, each with reliability r, the specified posterior log odds are (2k − n) × log(r / (1 − r)). Log odds are log(P(YES) / P(NO)). Each positive report adds the same amount of evidence, and each negative report subtracts it.
The experiments vary report count from 4 to 64, reliability across 52%, 55%, and 70%, and the share favoring YES. Fictional food inspections, product reviews, and scanner reports test the same probability rule under different wording. Prompts either list the individual reports or supply the YES and NO counts directly.
How reported probabilities scale
The analysis fits reported log odds against the specified log odds with an intercept. A slope below one means the reported log odds change too little with the evidence. A slope above one means they change too much. One is the reference rate of change, but a matching slope alone does not establish accurate individual probabilities.
For listed reports at 52% reliability, Jev's Noul readout has a slope of 0.60, with a 95% interval of 0.52 to 0.70. Under a short numeric-answer prompt, Llama-3.3-70B, Mistral-Small-3.2, and Haiku 4.5 have slopes around 2.0 to 2.8. Gemma-3-27B and DeepSeek-V3.2 have intervals that include one.
Reading reports and combining them
Separate questions ask whether each report favors YES. Jev identifies 33,039 of 33,048 reports correctly, or 99.97%. Accurate answers to these individual questions do not ensure that its direct probability gives the combined evidence the right weight.
For the 48-of-64 example, code can count Jev's individual readings and combine them using the supplied reliability and Bayesian rule. That calculation recovers 0.998. The model identifies the observations, while an explicit calculation handles their aggregation.
Giving Jev the counts directly raises its slope but leaves an error, so miscounting does not fully explain the result. The separate checks test observable behavior without showing how the model formed its direct probability.
The readout is part of the decision
Jev's Noul field returns a probability directly. Posing the same YES/NO question as a two-option Choice gives a different pattern. At 52% reliability in the listed format, Choice has a slope of 2.08, with a 95% interval of 1.93 to 2.22. It changes too strongly with the evidence while Noul changes too little.
A threshold-based system therefore needs evaluation of the readout and prompt it will actually use. Component accuracy or a correct final label cannot substitute for testing the probabilities that drive the action.
External aggregation worked here because reliability and independence were supplied. Real reports may repeat a source, influence one another, or have unknown reliability. Applying the same calculation requires accounting for those dependencies, rather than counting repeated claims as independent evidence.